The bar_chart URL:
- Allow the user to view in a bar chart how many entries there are for each topic, by sending them to http://localhost:8000/bar_chart/
- Add to code_journals/urls.py:
urls.py
python
20# --snip--
21urlpatterns = [
22	# --snip--
23	# Page for displaying a bar chart
24	path('bar_chart/', views.bar_chart, name='bar_chart'),
25
26]- This URL pattern will send requests to the bar_chart() view function
The bar_chart View Function:
- The view function for bar_chart is similar to the function for displaying entries:
views.py
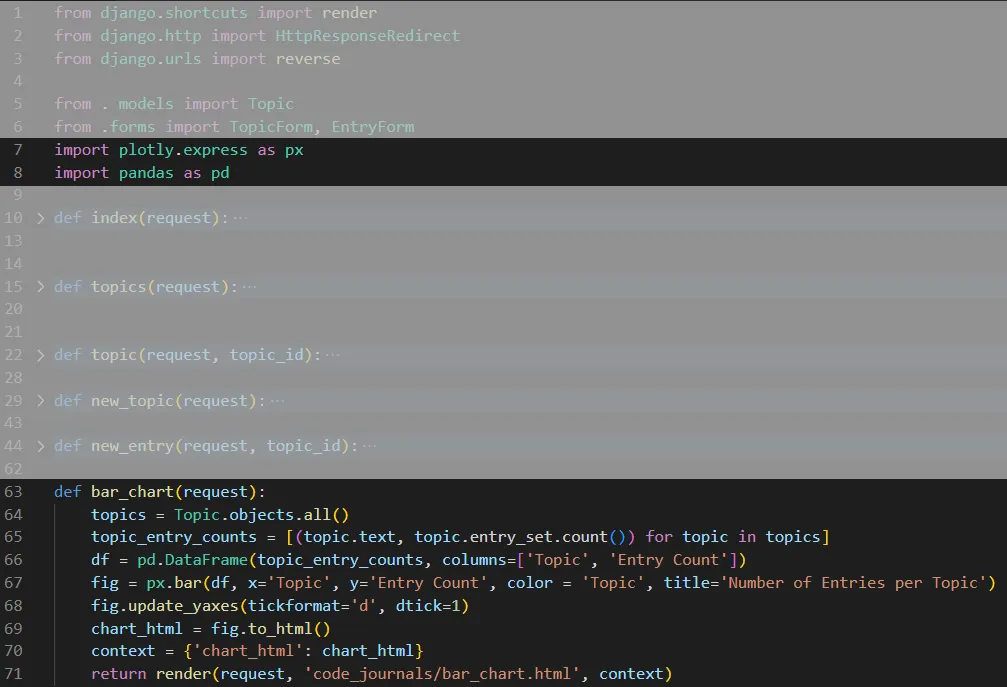
- In lines 7 and 8, we import plotly express and pandas.
- In line 64, we get all topics from the database.
- In line 65, we get the topic text and count the entries for each topic using topic.entry_set.count() and store the number of entries in the variable topic_entry_counts using list comprehension.
- In line 66, the list is converted to a pandas dataframe.
- In line 67, we create a bar chart using plotly express.
- In line 69, we convert the bar chart to HTML.
The bar_chart Template:
- The template for bar_chart renders the plot:
bar_chart.html
python
1{% extends "code_journals/base.html" %}
2{% block content %}
3<p>{{ chart_html | safe }}</p>
4{% endblock content %}- The child template is inheriting from the parent and on line 3 the safe filter is used to render the plotly express bar chart.
Linking to the bar_chart Page:
- Finally, we need to modify the base template to include a link to the bar_chart page:
base.html
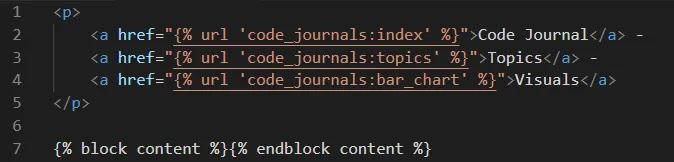
- In line 4 we tell Django to generate a link matching the URL pattern with the name ‘bar_chart’ in code_journals/urls.py