What is Plotly?
- Plotly’s Python graphing library makes interactive, publication-quality graphs online.
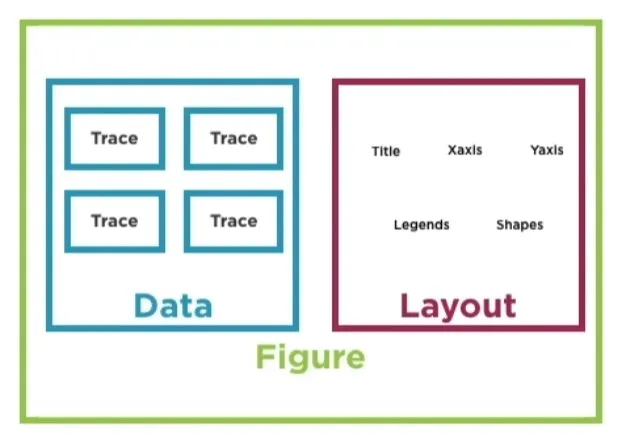
- Every Plotly visualization or plot is a JSON object and there are three elements of a plot1:
- Data: List objects in python which contains the traces (i.e., what is drawn to screen)
- Layout: Object that defines the look of the plot
- Figure: Final object to actually be plotted. It’s a dictionary-like object that contains both the data object and the layout object.
Install Plotly & Pandas:
- Packages such as Plotly and Pandas are available in a public repository called PyPI (Python Package Index)
- The tool can be installed from the command line using the Python Management System, pip.
- For Windows users, from the command line, running as an administrator, simply issue the following two commands:
| pip install plotly |
| pip install pandas |
- For Mac users, from a terminal, simply issue the following two commands:
| pip3 install plotly |
| pip3 install pandas |
Footnotes
-
Ravi, J. (n.d.). Building data visualizations using Plotly. Pluralsight. ↩