Lab 3: Filtering and Sorting:

Description: Create a new Jupyter Notebook file and name it Lab3-Filtering and Sorting.ipynb. Download the zip file containing WorldBank_GDPChange.csv. Extract it and read the data into a pandas DataFrame. Use Filtering and Sorting to create DataFrames that show the answers to the following questions. For each question, submit a screengrab that clearly shows both your Python code and the resulting DataFrame output. Your DataFrame output should match the format shown in the screenshots below.

  • Each question should result in a DataFrame that contains only the given number of rows.
  • For each filtering operation, β€˜prove’ that your filter worked correctly

  1. Question 1: What were the Top 10 Countries for Annual GDP Change?
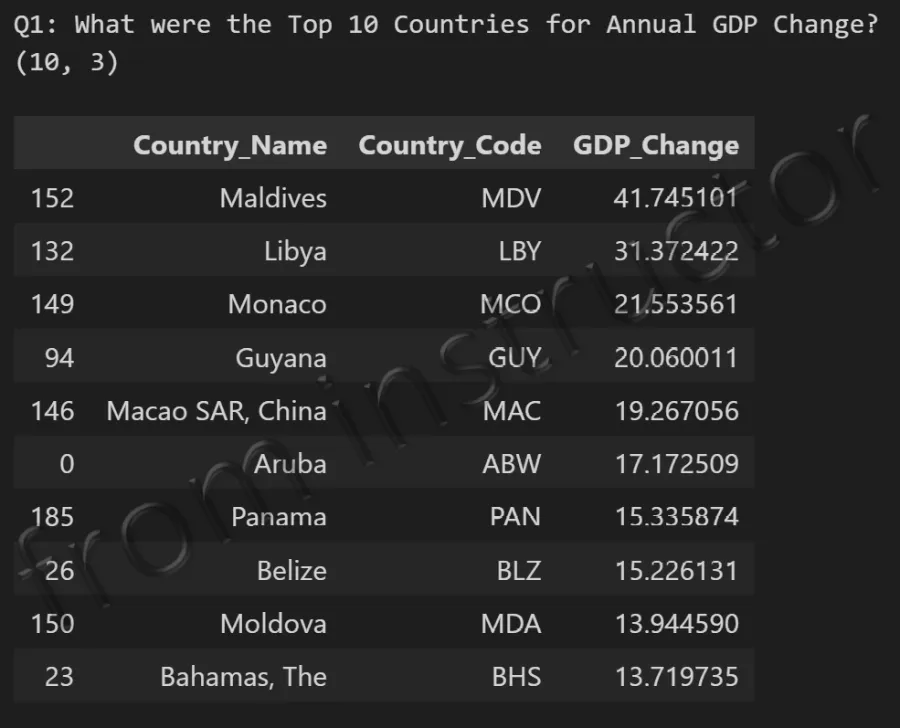
Expected output: WorldBank GDP DataFrame filtered and sorted to show top 10 countries by annual GDP change

Β 

  1. Question 2: What were the Bottom 15 Countries for Annual GDP Change?
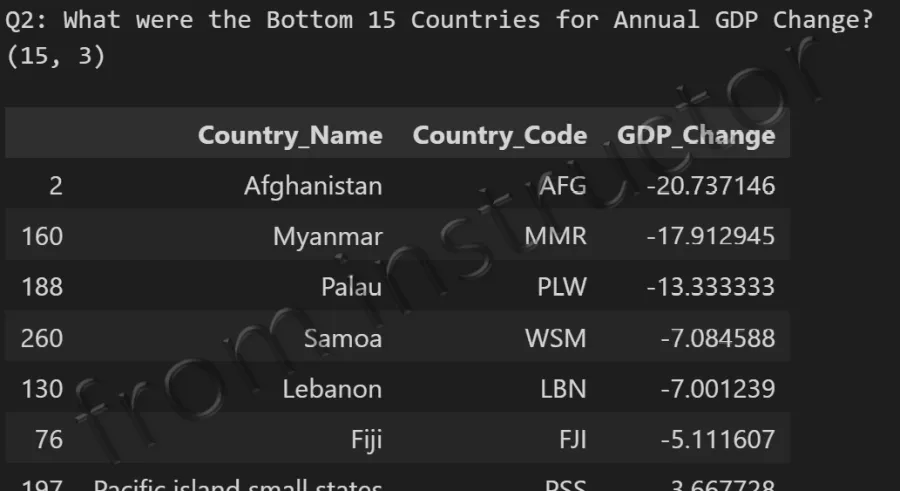
Expected output: WorldBank GDP DataFrame filtered and sorted to show bottom 15 countries by annual GDP change

Β 

  1. Question 3: What was the annual GDP Change for Denmark, Spain, Mexico, Canada, United States, and the Upper Middle Income Countries?
    • a. Sort this DataFrame by Annual GDP Change, Highest to Lowest
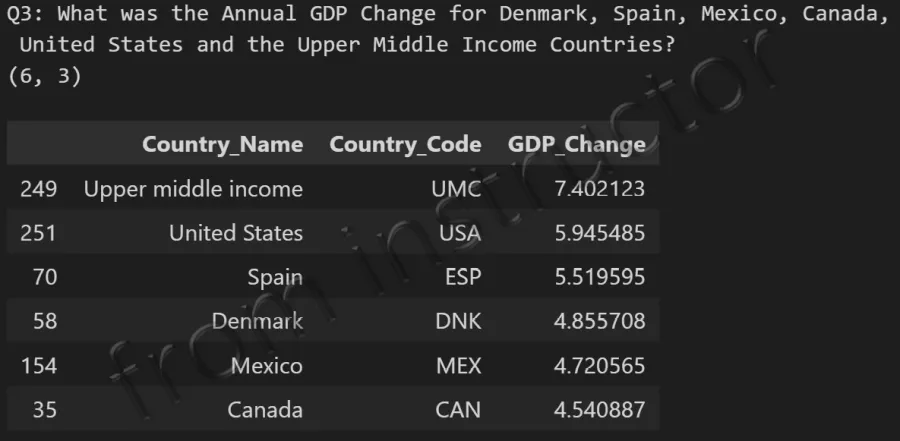
Expected output: WorldBank GDP DataFrame filtered for Denmark, Spain, Mexico, Canada, US, and Upper Middle Income sorted highest to lowest