Adding Bar Labels:
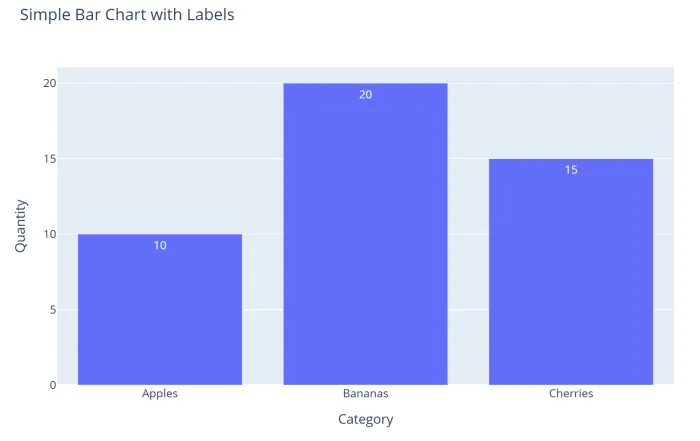
- The text attribute can be used to add labels to the bars in a Plotly Express bar chart.
- The code below creates a simple bar chart with three categories: Apples, Bananas, and Cherries. The text attribute is set to the Quantity column to display the quantity values on the bars.
python
1import pandas as pd
2import plotly.express as px
3
4# Create a DataFrame
5df = pd.DataFrame({
6    "Category": ["Apples", "Bananas", "Cherries"],
7    "Quantity": [10, 20, 15]
8})
9
10# Create a bar chart
11fig = px.bar(df,
12            x="Category",
13            y="Quantity",
14            title="Simple Bar Chart",
15            text="Quantity")
16
17# Display the chart
18fig.show()- Output:
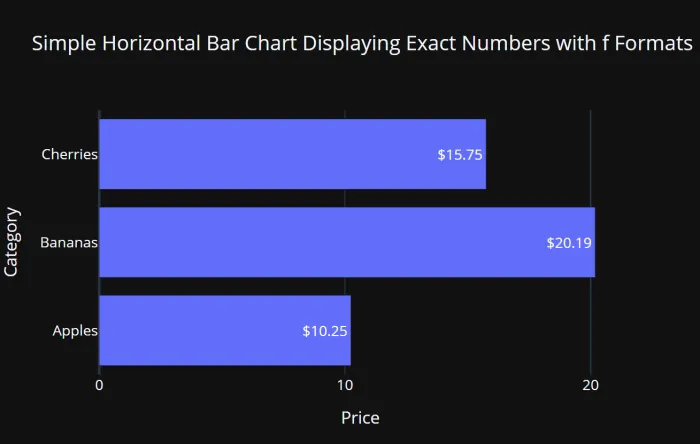
Formatting Bar Labels - Exact Numbers with f formats:
- Commas
- Number of Decimal Places
- Dollar Signs
python
1import pandas as pd
2import plotly.express as px
3
4# Create a DataFrame
5df = pd.DataFrame({
6    "Category": ["Apples", "Bananas", "Cherries"],
7    "Price": [10.25, 20.19, 15.75]
8})
9
10# Create a horizontal bar chart
11fig = px.bar(df,
12            x="Price",
13            y="Category",
14            title="Bar Chart Displaying Exact Numbers with f Formats",
15            template='plotly_dark',
16            orientation='h',
17            height=400,
18            width=600,
19            text="Price")
20
21# Update Figure Layout
22fig.update_layout(
23            xaxis=dict(
24            dtick=10)
25            )
26# -----------------------------------------
27# Formatting Bar Labels: Exact Numbers (f)
28# -----------------------------------------
29fig.update_traces(textposition='auto',
30                  #texttemplate='%{text:,}'      # Commas
31                  #texttemplate='%{text:,.0f}'   # Commas, 0 decimals
32                  #texttemplate='%{text:,.1f}'   # Commas, 1 decimal
33                  #texttemplate='%{text:,.2f}'   # Commas, 2 decimals
34                  texttemplate='%{text:$,.2f}'   # $, commas, 2 decimals
35                  #texttemplate='%{text:.0%}'    # Percent, 0 decimals
36                  #texttemplate='%{text:.1%}'    # Percent, 1 decimal
37                  #texttemplate='%{text:.2%}'    # Percent, 2 decimals
38                 )
39fig.show()- Output:
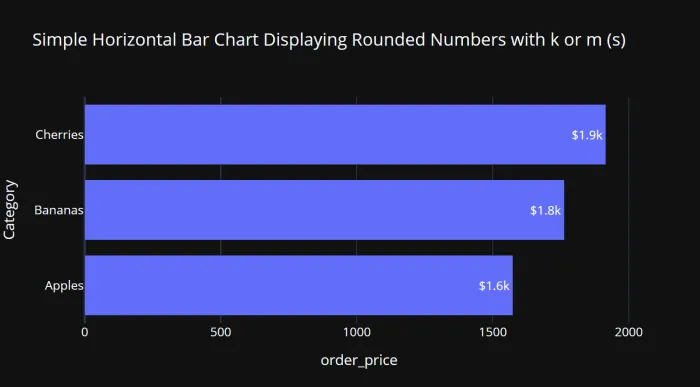
Rounded Numbers (k or m) with s formats:
- s formats can be used to display numbers to the specified number or in a rounded format, such as thousands (k) or millions (m).
- k or m are added automatically for thousands or millions.
python
1import pandas as pd
2import plotly.express as px
3
4# Create a DataFrame
5df = pd.DataFrame({
6    "Category": ["Apples", "Bananas", "Cherries"],
7    "order_price": [1574.25, 1763.19, 1915.75]
8})
9
10# Create a horizontal bar chart
11fig = px.bar(df,
12            x="order_price",
13            y="Category",
14            title="Bar Chart Displaying Rounded Numbers with k or m (s)",
15            template='plotly_dark',
16            orientation='h',
17            height=400,
18            width=700,
19            text="order_price")
20
21# ----------------------------------------------------------
22# Formatting the Bar Labels: Rounded Numbers with k or m (s)
23# ----------------------------------------------------------
24fig.update_traces(textposition='auto',
25                  texttemplate='%{text:$.2s}'      # $, 2 sig. digits
26                  #texttemplate='%{text:$.3s}'     # $, 3 sig. digits
27                 )
28
29fig.show()- Output: