Ex 3.10 Data Cleansing II and MCP Tool Development:
Objective: Reinforce data cleansing skills and techniques, then build an MCP tool that queries your cleaned data.
- Download the Ex3.10_DataCleansingAndMCPToolDevelopment.ipynb file.
- Using the IthacaDailyClimateJan2018expanded.csv data set and Claude Desktop, work through steps 1 through 12 and submit your completed Jupyter Notebook (.ipynb) file to the first quiz question on Canvas. Your notebook should include both your code and the corresponding output that match the screengrabs and code snippets provided below. Be sure to run all cells so that every output appears in the notebook.
Part 1: Cleanse the Data
Step 1:
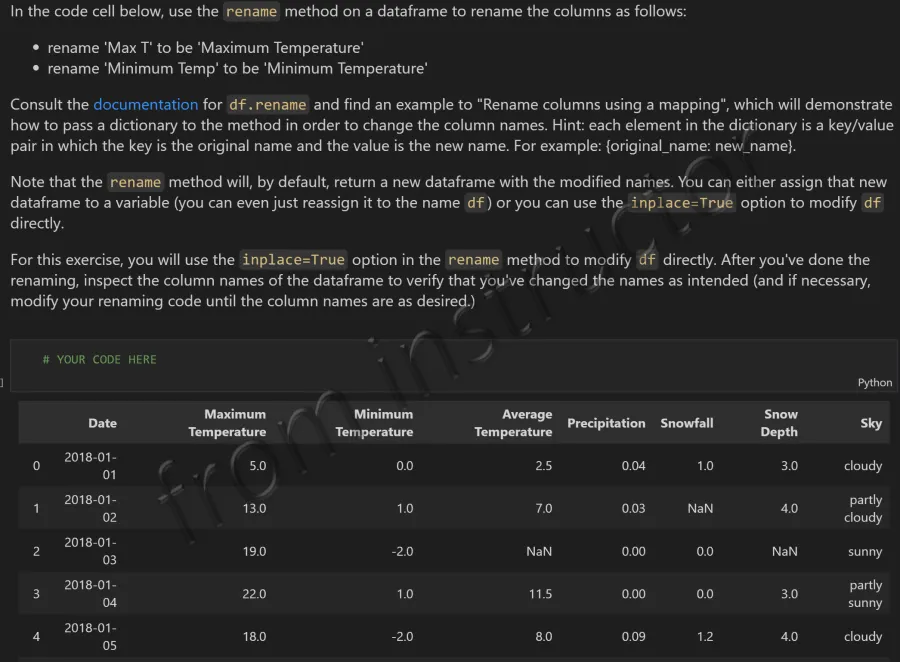
Step 2:
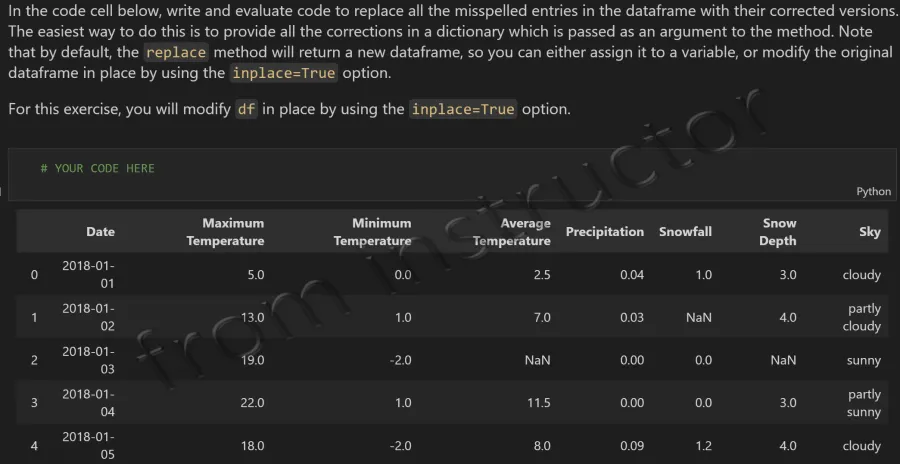
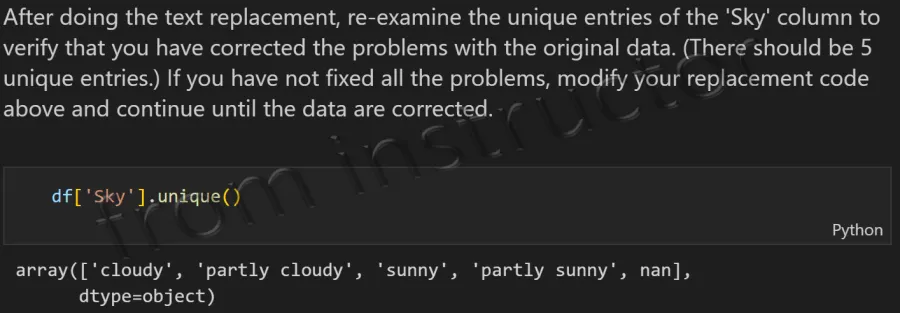
Step 4:
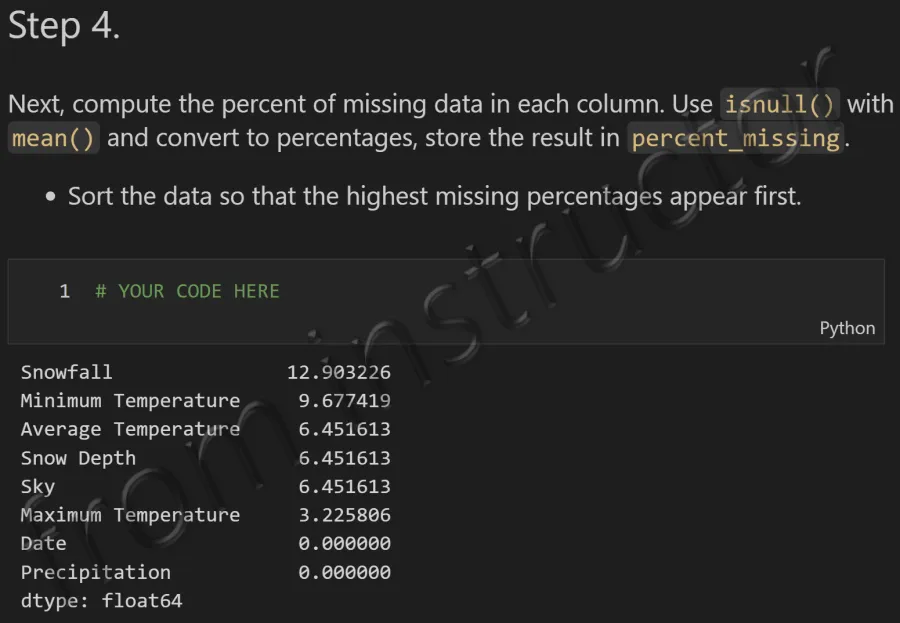
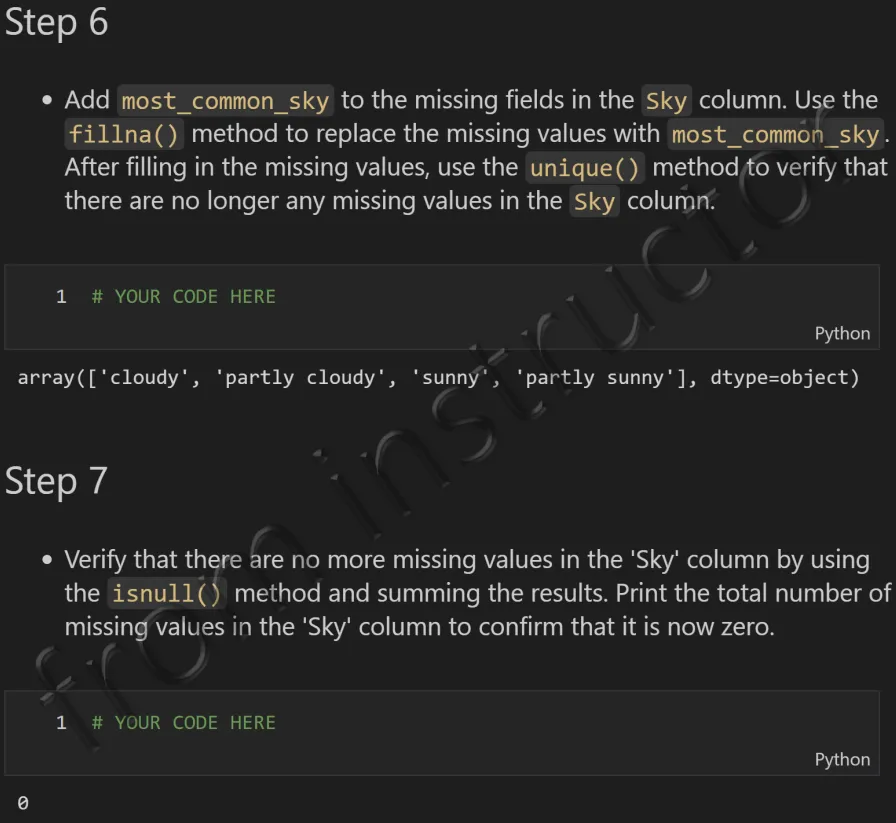
Steps 6 & 7:
Part 2: Turn Your Cleaned Data into an MCP Tool
- Before starting Part 2, read the Building an MCP Server for Claude Desktop course notebook page. The page walks through a complete worked example, average_temperature, using a small sample dataset. For Part 2 of this exercise, please build a similar tool of your own that queries your cleaned IthacaDailyClimateJan2018_cleaned.csv data set for total precipitation between two dates.
Step 8: In your jupyter notebook, export your cleaned DataFrame to a new CSV file so it can be used outside the notebook:
1df.to_csv("IthacaDailyClimateJan2018_cleaned.csv", index=False)Step 9: MCP servers can’t run as a regular notebook cell. Claude Desktop needs to be able to launch your server itself as its own program, so it can’t share a cell with the rest of your notebook. However, you don’t need to leave your notebook or create a separate workspace. In the VS Code terminal, staying in the same exercise folder as your notebook, run uv init --no-package. This sets up the folder as a simple project so uv can keep track of the libraries you install. Then add fastmcp and pandas:
1uv init --no-package
2uv add fastmcp pandas- Note: even if your notebook already uses pandas, add it here too. The Jupyter kernel your notebook runs on isn’t necessarily the same environment that uv run uses to launch your MCP server.
Step 10: Add a new cell at the bottom of Ex3.10_DataCleansingAndMCPToolDevelopment.ipynb and use the %%writefile cell magic to save an MCP server, named main.py, directly into your notebook’s project folder. Then, build a tool named total_precipitation that loads your cleaned CSV and returns the total precipitation between two dates:
1%%writefile main.py
2import pandas as pd
3from fastmcp import FastMCP
4
5mcp = FastMCP("ClimateTools")
6df = pd.read_csv("IthacaDailyClimateJan2018_cleaned.csv")
7
8@mcp.tool()
9def total_precipitation(start_date: str, end_date: str) -> float:
10    """Return total precipitation (inches)
11    in the Ithaca climate data between two dates."""
12    subset = df.query("Date >= @start_date and Date <= @end_date")
13    return subset["Precipitation"].sum()
14
15if __name__ == "__main__":
16 mcp.run()- %%writefile main.py must be the very first line of the cell — it tells Jupyter to save everything below it to the file main.py instead of running it as notebook code.
Step 11: Connect your server to Claude Desktop, following the Connecting the Server to Claude Desktop instructions (use “climate-tools” in claude_desktop_config.json, and point —directory at your notebook’s project folder — the same one that now contains main.py and your cleaned CSV). Completely quit and reopen Claude Desktop, then confirm your server is enabled.
Step 12: Start a new conversation in Claude Desktop and ask a question that requires your tool, for example:
1What was Ithaca's total precipitation from Jan 10–20, 2018?
2
3Claude: [calls total_precipitation("2018-01-10", "2018-01-20")]
4Ithaca got about 1.94 inches of precipitation from Jan 10–20, 2018.