Ex 3.6 Groupby(): One Column:
Objective: Learn how to aggregate data with pandas groupby() function. Acquire further exposure to changing data types.
- Create a new Jupyter Notebook file and name it Ex3.6_Groupby_OneColumn.ipynb.
- Work through parts 1 through 4 and submit your completed Jupyter Notebook (.ipynb) file to the first quiz question on Canvas. Your notebook should include both your code and the corresponding output that match the screengrabs provided below. Be sure to run all cells so that every output appears in the notebook.
Part 1:
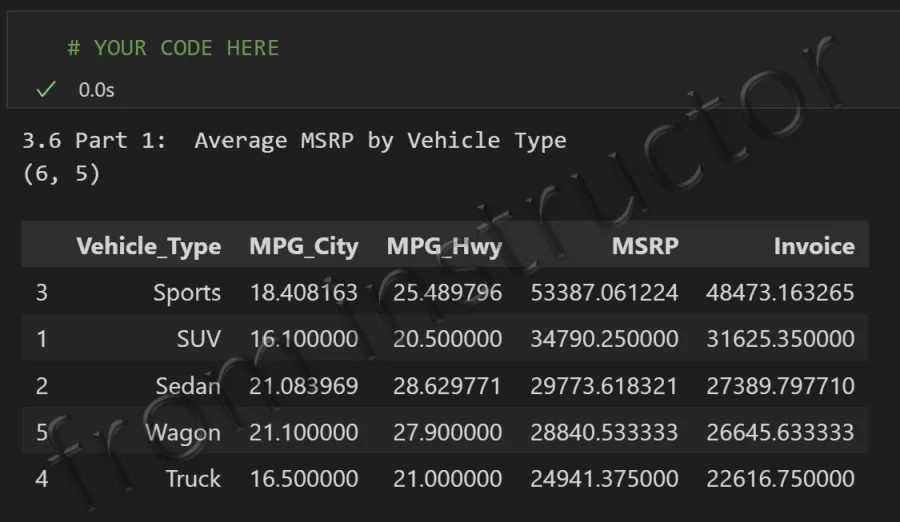
- Using the Cars.csv file, write code to answer the following question: What is the Average MSRP by Vehicle Type?
- a. Sort by MSRP (Greatest to Least)
Part 2:
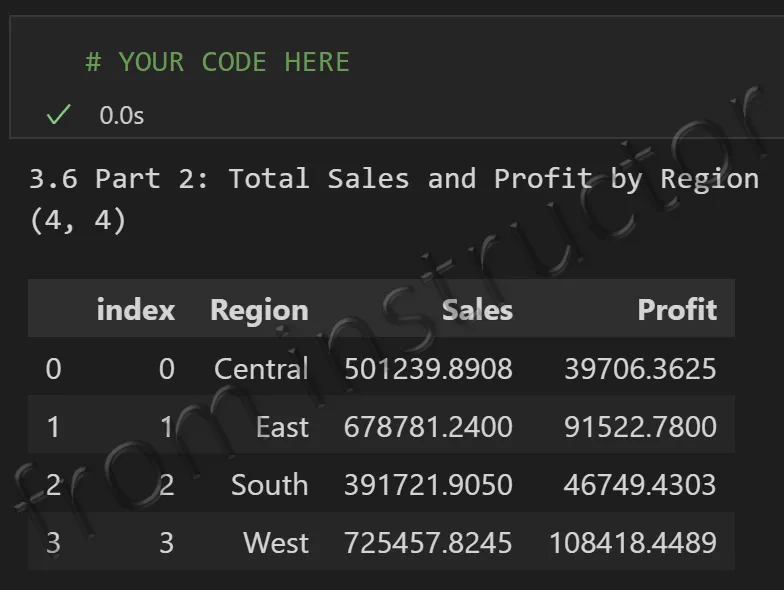
- Using the Sample - Superstore.xlsx file, write code to answer the following question: What are the Total Sales and Profit by Region?
Part 3:
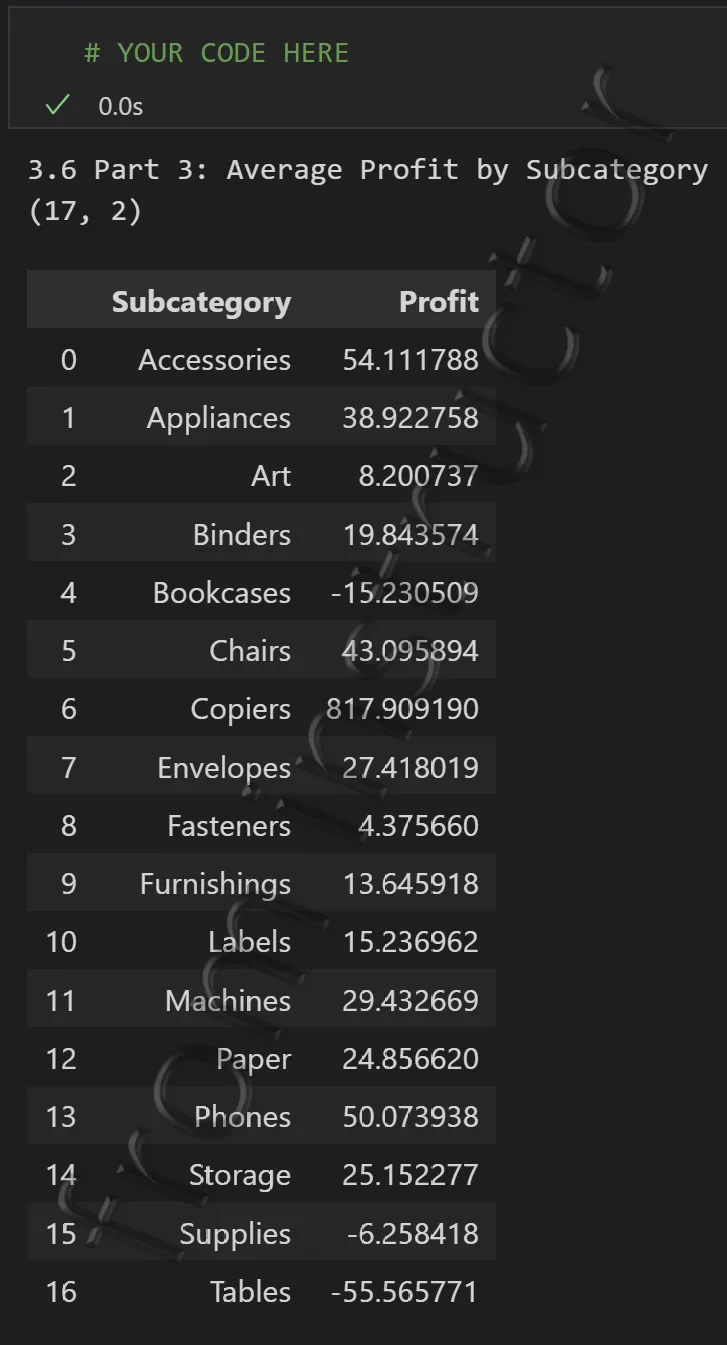
- Using the Sample - Superstore.xlsx file, write code to answer the following question: What are the Average Profits by Sub-Category?
Part 4:
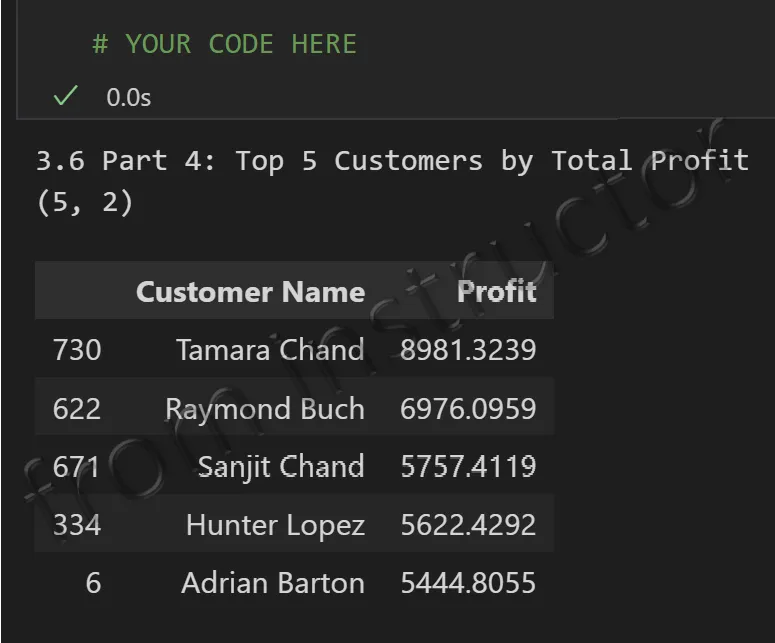
- Using the Sample - Superstore.xlsx file, write code to answer the following question: What are the Top 5 Customers for Total Profits?